Measuring your website load times
4 November 2013
Sometimes a website will be slower than normal to load. There can be a lot of reasons for this including: your browser, computer, local network, ISP, data cables, the hosting centre and the server or website itself.
If your website includes widgets or plugins from other services such as Facebook, AdSense, Google Search or Map, AddThis, Disqus, etc, then those items can also cause pages to take longer to load if their servers are congested or having problems.
So how can you tell what the reason is in order to do something about it?
The first step is to use a service such as GTmetrix which will load the page for you and identify any bottlenecks. They currently have test facilities in seven (7) regions around the world so you can pick the one nearest to you.
But this won't tell you of any local issues. Perhaps your ISP is having problems with their DNS server or router, your computer is overloaded, or the fact that you're logged into Facebook is causing their widgets to load more data.
Using Firebug (Firefox plug-in) or the Developer Tools in Safari you can generate your own waterfall charts.
To install and use Firebug to generate a timeline (waterfall diagram):
- install Firebug (Firefox plug-in);
- go to the website/page you want to check;
- Firebug menu -> UI Location -> Bottom;
- click the [Net] tab and click enable; and
- hold down Shift while reloading the page.
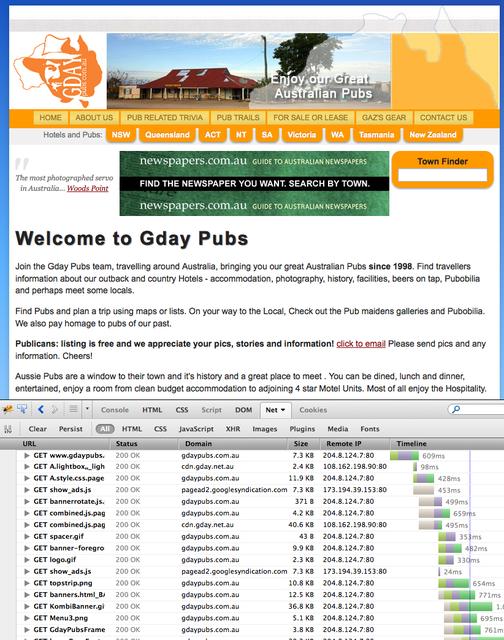
You should see something similar to the screenshot pictured right. The vertical blue line show the time that the page structure has loaded, and the red line when all the initial elements have finished loading.
Each row of the chart shows a single file being loaded, including the filename, source and file size. The width of the coloured bar on the right shows how long it took that item to load.